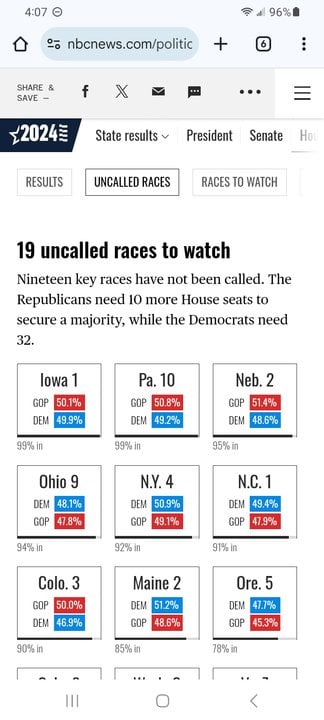
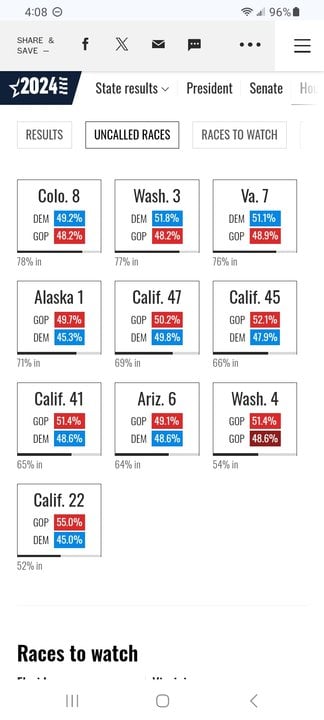
As the results finalize, it looks like swing state polling may have been a bit better than it was the last two presidential elections. But the familiar trend did emerge: polls underestimated Trump's performance almost across the board. At least some of the misses in polling averages were too much to credibly explain via random sampling error.
It should be noted that a few pollsters did very well. I'll give a shoutout to AtlasIntel, which polled the top battleground states with a freaky level of accuracy. (I'll also give a different kind of shoutout to Ann Selzer, whose final Iowa poll was a catastrophic miss.)
Now, to your question: polling is less of a science than many people believe, and there are numerous ways that things can go wrong. Here are a few.
1. Typically, pollsters don't publish their raw data. Once they've gathered their data, most will perform calculations that artificially make the demographics of their sample match the expected electorate. To put it another way, pollsters' assumptions are baked directly into their final published numbers. Done properly, this usually leads to better results. But it also makes it easy for bias to seep in (whether it be intentional or unintentional). Even an unbiased pollster can go astray if their assumptions about the electorate are wrong. I suspect (but don't know for sure) that this was part of the problem.
2. Poll "herding" seems to be a real phenomenon. Statistically speaking, outlier polls should happen sometimes. But nobody wants to actually be the outlier. So what does a pollster do if the election is near, and their result is far off of the polling average? Well, it seems that some pollsters in this situation muck with their numbers to make their result closer to the polling average - that is, closer to the "herd". The herding in the final few weeks was conspicuous enough that it was visible to the naked eye. Herding can cause the published polls to miss real shifts in the closing weeks. My guess is that herding didn't really create error this time. But it still means that some polls in the last few weeks weren't really giving us new information.
3. As Becky mentioned, it seems like Trump's voter base is just less likely on average to participate in polls. Pollsters seem to believe this was their main problem in 2020, and I think it likely accounted for part of the underestimation of Trump in 2024. It'll be interesting to see how polling does in the future, when Trump is no longer on the ballot.
4. When you see an election forecast, it's usually based on some method of aggregating polls together. This means that the forecast you see (e.g. "98% chance of a Hillary Clinton win") has already passed through two "filters": that of the pollster, and that of the aggregator. Averaging polls together is great because it should largely smooth out the effects of random sampling error. But the aggregator's modeling decisions and biases may have significant sway over their results. They might exclude or give lesser weight to pollsters they consider to be "low quality". (For example: fivethirtyeight chose to exclude Rasmussen from their 2024 model, for... somewhat questionable reasons, IIRC. And with the results in, Rasmussen appears to have been one of the most accurate pollsters of this election.)


