5lutmuffin · F
Use the bell curve/ normal distribution to help you picture your data
SeductiveCactus · 26-30, F
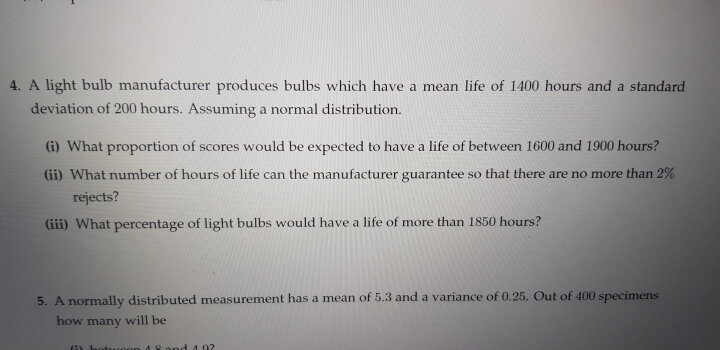
@5lutmuffin yup my assignment is based around normal distribution statistics. I have a z table to use so I'm just gonna try what I think and hope if it's super wrong ill so least get points for trying haha.
Unlearn · 41-45, M
Lol you get your assignments done on SW??? Well! At least you're being productive...
SeductiveCactus · 26-30, F
@Unlearn every now and again Haha as long as I don't get the answer and just the start on how to do it I thought it'd be fine 😂

SW-User
no
SeductiveCactus · 26-30, F
@SW-User thnx for the support

SW-User
@SeductiveCactus np if i was more awake, then maybe
MartinTheFirst · 26-30, M
it has to do with its percentage. They're talking about how much is +- 2% in deviation
View 1 more replies »
MartinTheFirst · 26-30, M
@SeductiveCactus how did it go?
SeductiveCactus · 26-30, F
@MartinTheFirst I should get the results at the end of the week haha. I'm pretty sure I ended up working out the right way to doing it.
MartinTheFirst · 26-30, M
@SeductiveCactus good job
kentex35 · 100+, M
I'm scratching my butt on that one.


