Update
Only logged in members can reply and interact with the post.
Join SimilarWorlds for FREE »

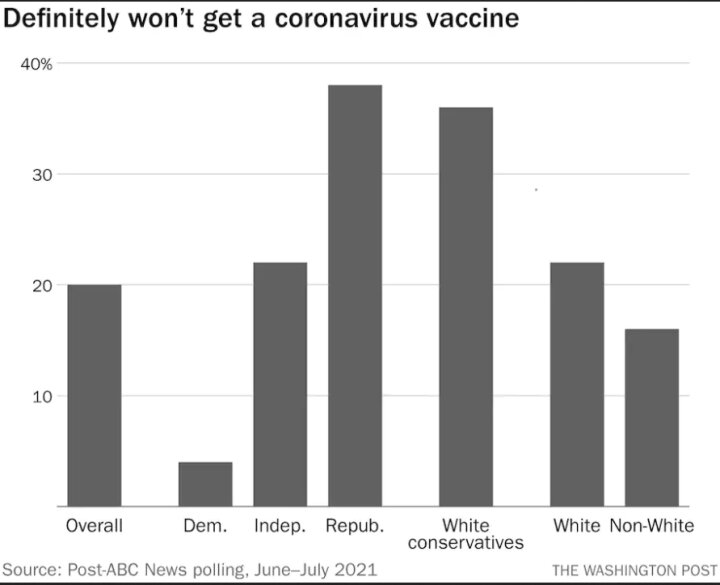
Interesting poll of which demographics are refusing the vaccine

This data is a month old now, but this is a poll of who plans to refuse the vaccine


[b]Update:[/b] Wow! I got a [i]downvote[/i] for providing [i]facts![/i] What kind of [i]coward[/i] downvotes facts??
This page is a permanent link to the reply below and its nested replies. See all post replies »
Burnley123 · 41-45, M
Just to crunch the stats, I think this means non white Conservatives are the worst group. Given that Republicans is higher than white Conservatives.