Asking
Only logged in members can reply and interact with the post.
Join SimilarWorlds for FREE »

Where did the Votes go?

Trump wins by just under 74 million votes and Kamala loses by just over 69 million votes.

Back in 2020 Trump lost by just over 74 million votes and Biden won by over 81 million votes.

So where did those 21 million + Democrat votes go?
This page is a permanent link to the reply below and its nested replies. See all post replies »
Your math is clearly wrong as it isn't 21 million...

When this stupid argument started, there were still a ton of votes being counted, even if they knew whom won the state, they didn't know the exact number of popular votes.

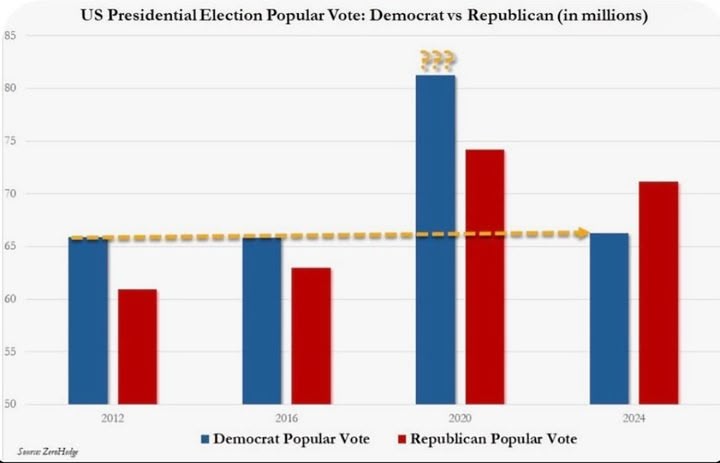
As you can see in the graph below, when this started, even Trump had less votes in 2024 than he did in 2020.

But that's not correct, as they keep counting, Trump got more votes in 2024 than he did in 2020.

2020
81.28m for Biden
74.22m for Trump

2024 (so far, and they might not be fully done counting yet)
74.25m for Trump
70.35 for Harris

So instead of your 21 million, it's actually less than 11 million.

And really, one would need to go into more details of which states (or if it's about equality among all) the that voted less, as a lot of states are basically known which way the state is going. So less people might show up.

It's really only the battle ground states that matter big time.
Washington Post claims to have the state by state breakdown, but it's not free so I couldn't get access to it.

But the guardian had a pictures version.

https://www.theguardian.com/us-news/ng-interactive/2024/nov/06/the-key-swings-that-handed-trump-the-white-house-a-visual-analysis

Looking at the map below

Considering Trump got about the same ending number (so far), I think we can assume the 1 point shifts (at least the red dashes) are less democrats showing up to vote in those areas.

Looks mostly like states where Trump was projected to win no matter what, and also Pennsylvania, Virginia and Northern Illinois.

But PA and GA are the battleground states, most of the others were thought to be fairly locked already.
dakotaviper · 56-60, M
@sstronaut well you sure proved something with your graph. If you take a look at it subjectively, 2012-2016-2024 are proportionate for the Democrats and 2012-2016-2020-2024 are also proportionate for the Republicans. The only obscure one is the Democrat vote in 2020. That's still 10 million + votes GONE with the utter hatred portrayed by the Left of Trump since 2020. Coincidently, that's the same amount of 'Mail-In' votes that Biden gained from 3:30am to 3:58am on November 4th, 2020. Kind of makes you wonder if the Trump claim of 'Voter Fraud' back in 2020 was actually True or Not. Also makes you wonder who is willing to Cover-Up Voter Fraud.

So who's actually calling the shots here in the USA?
@dakotaviper But you missed the point that the graph is based on a lie.

That's 2012, 2016, and 2020 final numbers... that's only the early numbers in 2024, not the final numbers. Where 2024 Trump beat 2020 Trump which the graph fails to show.

The numbers for both have gone up a lot in 2024 from where this graph starts.