This page is a permanent link to the reply below and its nested replies. See all post replies »
4meAndyou · F
I would love to see the same chart for 2025! I KNOW that some prices are lower now.
DanielsASJ · 36-40, M
@4meAndyou Yes, they are. That's why graph is steady on the right border.
DanielsASJ · 36-40, M
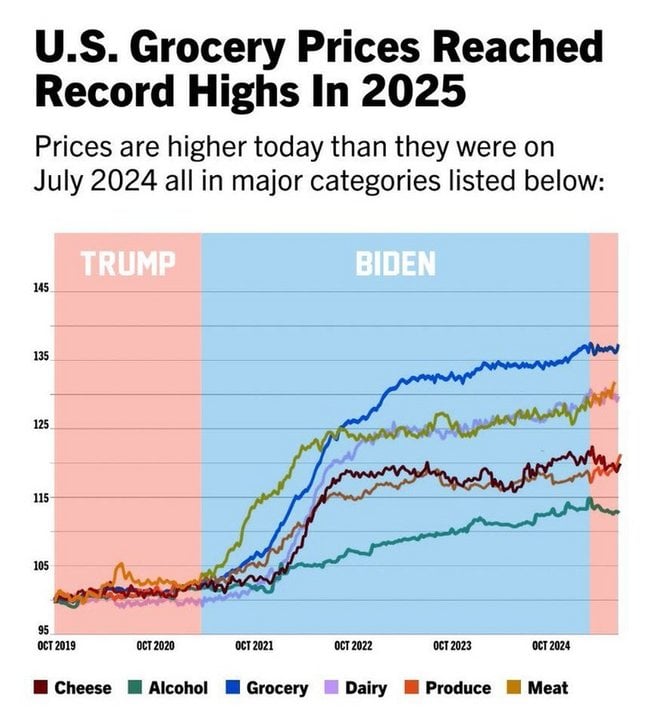
@4meAndyou This was the data published by the democrats but they forgot to divide it in Biden vs DJT period.
Later on, when Republicans got this chart, they divided it into 3 parts. DJT period 2017-20, Biden - 2021-24 and then DJT period starting from 2025 onwards which proved for democrats that common sense is not so common.