In 1875, Ohio farmer Samuel T. Benner published Benner’s Prophecies: Future Ups and Downs in Prices—a unique market forecast based on cycles observed in commodity prices like hogs, corn, pig iron, and cotton
Despite lacking modern tools, Benner mapped out recurring patterns:
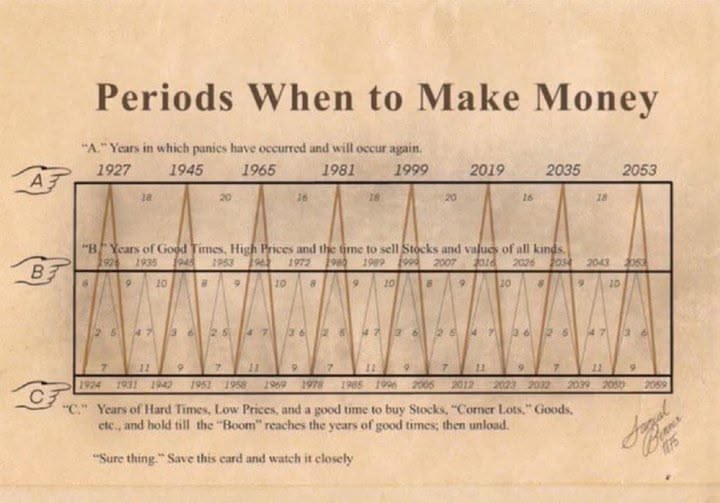
A 27‑year minor cycle, with downturns every 7, 9, or 11 years and booms every 8–10 years An 11‑year cycle in pig iron, corn, and cotton prices, alternating peaks every 5–6 years He categorized each year into three phases: Panic years (A): irrational surges or crashes—times to sell
Good times (B): high prices—ideal time to sell assets
Hard times (C): low prices—optimal for buying and holding
🔍 Surprising Accuracy Across 150 Years** Benner’s model has aligned—sometimes remarkably well—with major market crises:
The Great Depression (1929)
The Dot‑Com crash (~2000)
The Financial Crisis (2007‑08)
The COVID‑19 crash (~2020)
Quantitative reviews show: Benner’s favorable years (B) delivered average annual returns around 11.7%, versus only ~6.6% in unfavorable years (C) during the 27‑year cycle
Over 54‑year major cycles, favorable years outperformed with ~9.9% vs 4.7% average returns—with notably less volatility.
⚠ Why It’s Fascinating — And Flawed What’s compelling: Benner created a macro‑scale pattern long before modern economics or computing. His focus on emotional and cyclical market behavior resonates with the timeless rhythms of fear and greed.
What’s limiting:
The model often missed exact timing—sometimes by several years—for events like the Dot‑Com bust or the 2008 crash
Critics warn that it may reflect survivorship bias, cherry‑picking, and lack of real predictive rigor—making it more of a historical curiosity than a reliable tool Medium
🔮 Looking Ahead: What Benner Predicts Now According to modern extensions of Benner’s chart:
The period 2023–2025 is marked as a post‑panic recovery phase (C → B)
2025–2027 could be a peak or overheat phase (B)
Followed by a difficult stretch (A/C) from 2027–2032
These align intriguingly with broader cycles—like the 18‑year crests in real estate (~2026)
Samuel Benner’s forecast—born from commodity farming over 150 years ago—has pulled in some eerily accurate landmarks. Yet economists caution it’s not a surefire playbook. Think of it as a macro‑timeline of human behavior, not a precise calendar. Still, it offers a fascinating historical lens on cycles that still echo in today’s markets. — in London, United Kingdom.