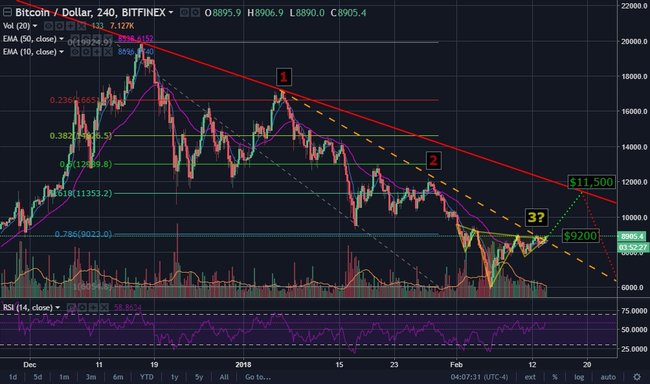
Right now, Bitcoin is attempting for the 3rd time to breach a major resistance level (orange dashed line) at the 0.78 Fibonacci level.
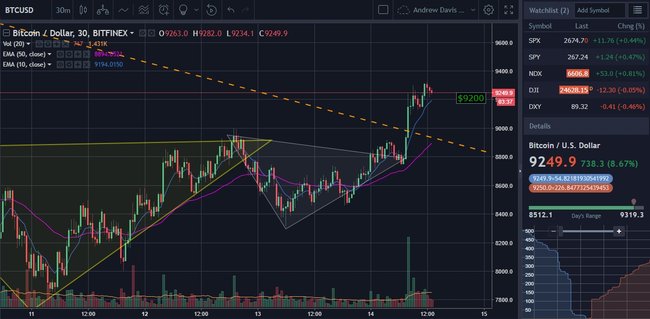
We are exiting an Inverse Head And Shoulders (bullish indicator) pattern at this moment (the yellow triangles), successful exit should see us into further upward movement.
Also, we see the price line almost about to cross over the 50 EMA (blue curving line). 50 EMA about to cross over 10 EMA (purple).
At current RSI of 58.8, we are not yet at the upper limit.
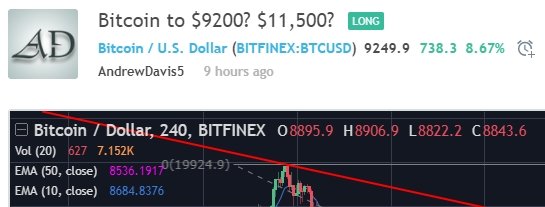
We may be able to see prices of $9200 within the next day or two.
After this, we may possibly reach as high as ~$11,500 USD over the following week.
Then after this, we hit an extremely strong resistance level, and another crash (to sub $6000) may occur.
Let's see if BTC can break this important resistance level.
(Note, this chart is an enlarged scale (4 hour chart), spanning from December 2017 to February 2018)