let me show y’all something real quick. Hopefully you actually read this chart, cause that’s what #they dont want us to do.
They would prefer we watch the news and ingest the biased views they spew. You can’t argue with facts 🤷🏽♀️ Pretty strange how the media shows a totally different perspective...
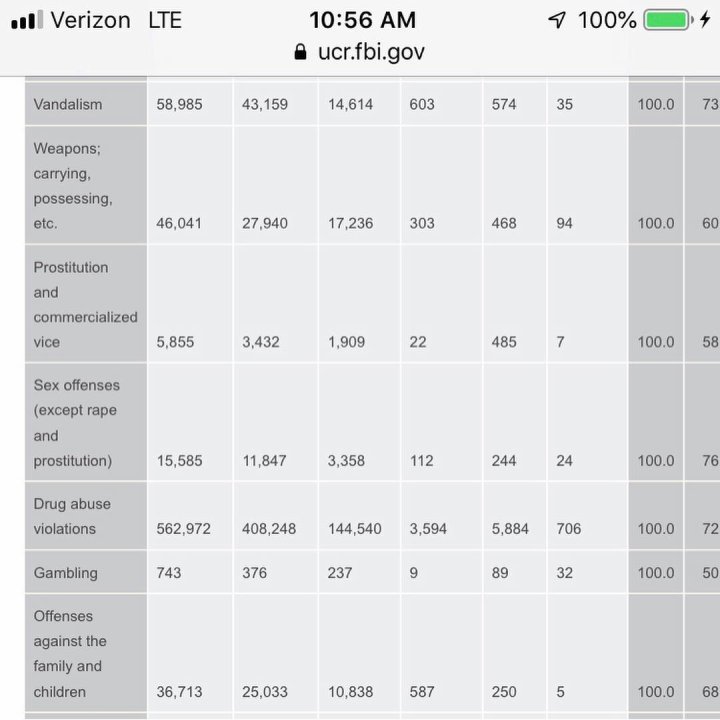
*This is from the #fbi website*
This page is a permanent link to the reply below and its nested replies. See all post replies »
I think what @SW-User is suggesting is that, though these arrest percentages are interesting, if you looked at what percentage of each population these represent, there might be a different story.
Since "white" clearly includes Hispanics in this table, let's see, if I use your info from the FBI and est. 2015 population info [I think it was published in 2016] using the same categories (from a US Census Bureau doc, as quoted at [i]https://en.m.wikipedia.org/wiki/Demography_of_the_United_States[/i]; see n. 64 of that webpage), then we can look at
total arrests as percentage of racial pop'n:
White 2,519,094/233,657,078 * 100% = 1.08%
Black or AA 901,211/40,241,818 * 100% = 2.24%
American Indian or Alaska Native 35,099/2,597,817 * 100% = 1.35%
Asian 38,843/16,614,625 * 100% = 0.234%
Native Hawai'ian or Other Pacific Islander 5,601/560,021 * 100% = 1.00%