Update
Only logged in members can reply and interact with the post.
Join SimilarWorlds for FREE »

Doubts about climate change?

Here’s what got that seed of doubt sown. 30 years ago A bold plan was hatched Americas oil industry execs and a top PR guru. An $850,000 a day contract was at stake meaning it was in the oil industry’s best interests to create seeds of doubt about climate change.
A bit like the NRA telling supporters that guns don’t kill people.

Obviously the plan worked because climate changed doubters are everywhere today. Sadly actual climate change is wacking us in the face every hour of every day.
This page is a permanent link to the reply below and its nested replies. See all post replies »
@Thinkerbell Starting here so the graphs don't scroll away.

This graph ends at the end of 2016, shows definite negative 2nd derivative.
Source: "5 ways to think about the remarkable slowdown in global CO2 emissions"
[b]https://www.vox.com/energy-and-environment/2017/3/21/14998536/slowdown-co2-emissions[/b]
[quote]This pause in CO2 emissions growth, the IEA says, was driven by “growing renewable power generation, switches from coal to natural gas, improvements in energy efficiency, as well as structural changes in the global economy.” Notably, US energy-related emissions fell 1.6 percent in 2016, thanks to the ongoing shift from coal to cleaner natural gas, wind, and solar. Chinese coal consumption appears to be declining (though stats can be unreliable there), led by a shift away from heavy industry. And Europe’s emissions stayed flat last year.[/quote]

This graph shows a big drop for the pandemic year; ignore that; it still shows a flattening of emissions.
Source: [b]https://theconversation.com/global-emissions-are-down-by-an-unprecedented-7-but-dont-start-celebrating-just-yet-151757[/b]

Yet another analysis showing leveling off of CO2 emissions:
Source: [b]http://country.eiu.com/ArticleIndustry.aspx?articleid=389146622&Country=China&topic=Industry&subtopic=Energy[/b]
[quote]Global CO2 emissions flat-lined in 2019 following two years of successive increases, according to estimates released in February by the International Energy Agency (IEA). This was achieved despite an over 2% increase in global GDP. The rate of growth in annual CO2 energy-related emissions in the last six years has slowed by two-thirds to 0.6% in 2013-19, compared with 1.8% in 2007-13. This suggests a weakening correlation between GDP and emissions growth, which is a positive sign.

However, recent progress in emissions reduction is heavily skewed towards high-income countries, where coal in the power sector has been displaced by renewables and gas. Meanwhile, emissions in the rest of the world are still increasing, as are emissions from oil and gas use. Global emissions growth might be slowing to a walk, but substantive emissions reduction needs to be seen in areas other than the power sector in high-income countries. [/quote]

It's not just one graph or one report. There's lots of evidence of leveling off of CO2 emissions, prior to the pandemic.

Another:
[quote][b]Global Emissions Were Slowing Even Before the Pandemic[/b]
Releases of greenhouse gas dwindled thanks to declining coal use and new climate and energy policies coming into effect.

The growth rate of human-created greenhouse gases was slowing even before the pandemic hit the global economy—just not fast enough to hold back the rate of climate change.

Global carbon dioxide emissions from fossil fuels increased just 0.1% in 2019 from the previous year. In 2020, they’ll fall a record 7%, to 34 billion metric tons of CO₂, according to the Global Carbon Project, an international effort by researchers to measure CO₂ emissions. The results line up closely with a major United Nations report released this week that also showed an anticipated 7% drop in emissions this year.

“This level of reduction is unprecedented and about five times bigger than the drop during the global financial crisis in 2018,” said Pep Canadell, executive director of the Global Carbon Budget. “Although the future is yet to be written, there is indeed an unprecedented opportunity that could curve down the future trajectory of emissions if we actively choose to do so.”[/quote]
Source [b]https://www.bloomberg.com/news/articles/2020-12-11/global-emissions-were-slowing-even-before-the-pandemic[/b]
Thinkerbell · 41-45, F
@ElwoodBlues

[quote]"You fit a LINE!!! And you're surprised that when you fit a line the result is linear and it's second derivative is zero??"[/quote]

No, I'm not surprised at all.
I [i]would[/i] be surprised if adding higher degree polynomial terms would give your wished-for negative second derivative.

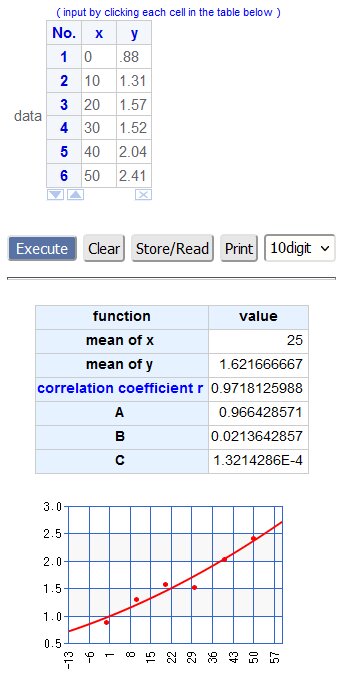
So just to make you happy, I did a quadratic fit.
As expected, the quadratic term had a positive coefficient, so the 2nd derivative, if anything, is >0.
The fit curve is concave UP, not down.


In the table x=0 corresponds to 1965, other values of x correspond to years after 1965.
The y values are the corresponding 10-year average CO2 changes in ppm/year.

You are welcome to try a higher degree fit if you like.

Also, you keep clinging to claimed carbon [i]emissions[/i] data, without ever addressing the reliability of that data, and more importantly, without ever showing that these purported moderations in emissions increases have had a corresponding effect on atmospheric CO2.

This lack of corresponding effect on atmospheric CO2 has been obvious since my first comment on the subject.
@Thinkerbell I applaud your polynomial fitting efforts! But, with only six degrees of freedom in your data, higher order polynomials would definitely suffer from overfitting issues. Having averaged away most of your data, there's not much left for it to tell you.

If you like statista as a data source, they also have a time series of CO2 per year at [b]https://www.statista.com/statistics/276629/global-co2-emissions/[/b] Take a look, it shows the same behavior in recent years as the four curves I posted above; essentially identical to the Bloomberg curve.

When fitting data to polynomials (or any other parameterized function) you'll can always reduce fitting error by adding more degrees of freedom to your function (AKA model). But first you need to explain your model. Quadratic? Great, but why a quadratic? Is there something about atmospheric physics or the nature of human CO2 emissions that leads you to believe quadratic is the right model? What about sigmoid? Fourier series? Spherical harmonics? Same questions - how do you motivate that model over other models?

Since neither you nor I specialize in atmospheric physics and chemistry, I leave those arcane details to the modelers, who are training and testing their models on the last 700,000 years of climate data (covering about 7 ice ages) as recovered from glacial bubbles, sea floor sediments, and lake sediments. And the modelers consider not only CO2, but methane, temperature, atmospheric H2O, and a number of other variables.

I'm sorry, but with all that other data & analysis out there, I'm not going to be swayed by your six CO2 data points made up of ten year averages.
Thinkerbell · 41-45, F
@ElwoodBlues

[quote]"I'm sorry, but with all that other data & analysis out there, I'm not going to be swayed by your six CO2 data points made up of ten year averages."[/quote]

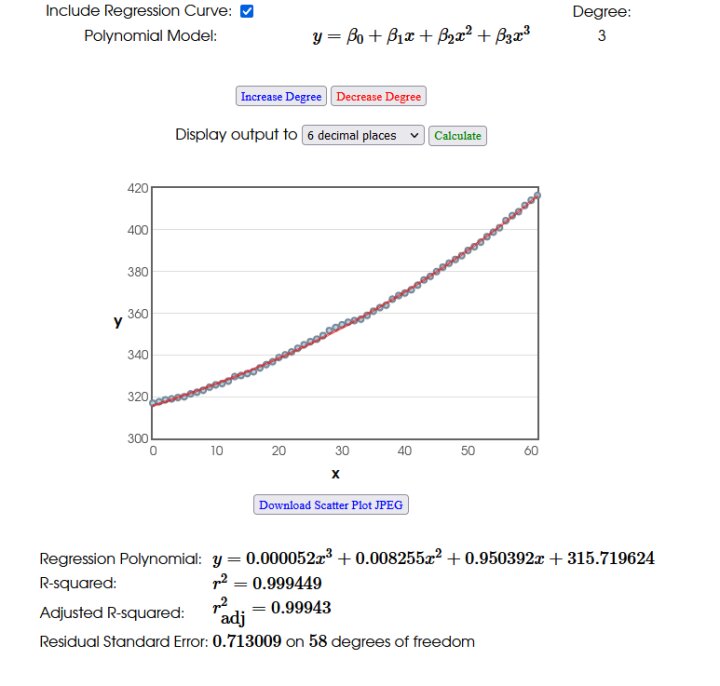
OK, since you insist, here is a cubic polynomial fit to [i]all[/i] of Statista's worldwide [i][i]atmospheric[/i][/i] CO2 data between 1960 and 2021.


On the x-axis, 0 corresponds to the year 1960, other points to years since 1960.
The y-axis corresponds to worldwide [i]atmospheric[/i] CO2 in ppm, as per Statista.

[c=009E4F]https://www.statista.com/statistics/1091926/atmospheric-concentration-of-co2-historic/ [/c]

As you can see, the coefficients of the powers of x are all positive, the curve is concave up, the 2nd derivative is[i] positive[/i], as is obvious from even a visual glance at the Statista data.

[quote]" But first you need to explain your model. Quadratic? Great, but why a quadratic?... What about sigmoid? Fourier series? Spherical harmonics? Same questions - how do you motivate that model over other models?"[/quote]

Easy as pie.
For the purpose of determining the character of the 2nd derivative, a polynomial fit is easiest, involving only simple differentiations.
Expansions in terms of other functions that give good approximations would tell you exactly the same thing, but the calculations would be more difficult.

But now back to my early question, which you have been consistently [i]dodging:[/i]

WHY HAVEN'T THE ALLEGED MODERATIONS IN THE INCREASES OF CO2 [b]EMISSIONS[/b] SHOWN UP AS CORRESPONDING CHANGES IN [b]ATMOSPHERIC[/b] CO2 LEVELS?
@Thinkerbell Sorry for being so slow getting back to this. And thank you for your newest lovely polynomial fitting efforts. I really mean that. However (you know a however was coming):

That fit is a great way to illustrate a 60 year trend. It's NOT a great way to illustrate if we have been [i]diverging[/i] from that trend for the past 5 years or so. The sites I link to in the top post all say we appear to be leaving the old trend.

In your plot, divergence from the trend would show up as recent data having a growing error from the curve; bending a bit downward as the trend curve accelerates upwards, so negative error. Could you possibly show us what the "errors"* to the fit look like? Especially the last ten years of errors.

* I'm putting errors in quotes because, as you know, least squares fit assumes all data that deviates from the fitted curve are "noise" or "errors." Not a big problem as long as we remain aware that the data might be saying something slightly different from the assumptions of the fit.
Thinkerbell · 41-45, F
@ElwoodBlues

[quote]"In your plot, divergence from the trend would show up as recent data having a growing error from the curve; bending a bit downward as the trend curve accelerates upwards, so negative error. Could you possibly show us what the "errors"* to the fit look like? Especially the last ten years of errors."
[/quote]
Ok.

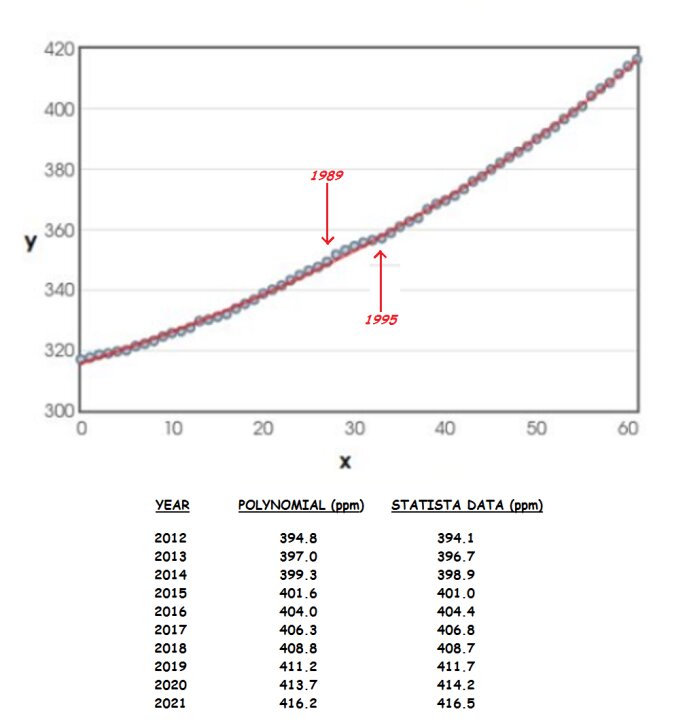
The "noise" level is about 0.5 ppm, and if anything, the data has been showing a [i]positive [/i] "error" in the past few years.

No sign of a statistically significant downward inflection in the past 10 years.


One might more realistically have argued that a negative inflection occurred around 1989,
alas, only to have been countered by a larger positive inflection in 1995.

So I repeat:
WHY HAVEN'T THE ALLEGED MODERATIONS IN THE INCREASES OF CO2 EMISSIONS SHOWN UP AS CORRESPONDING CHANGES IN ATMOSPHERIC CO2 LEVELS?

To which I might add:
WHY DO YOU PUT SO MUCH STOCK IN EMISSIONS "STATISTICS" THAT THE GOVERNMENTS IN QUESTION HAVE EVERY REASON TO FUDGE?