Inflation: CPI Calculator from the US Bureau of Labor Statistics
Is the Biden administration staging an inflation disinformation campaign? I've provided a link below to the goverment's (USBLS) own tools used to calculate the CPI. The data tools within the site are a bit clunky, but if you are willing to dig a little, you can obtain a lot of good information on how much more you are spending on goods and services.
The results I found are based upon a start date of January 2021 (when Biden first took office) until the most recent data collection in late April of 2024. The numbers represent averages for the entire country. What you experience in your locale may be different.
From 2021 to present day: Overall inflation: +19% Gas: +55.5% Groceries: +21.3% Eating out: +21.8% Pet food: +23.1% Rent: +20.8% Electricity: +28.5% Natural gas: +22% Real average weekly earnings: -4.4%
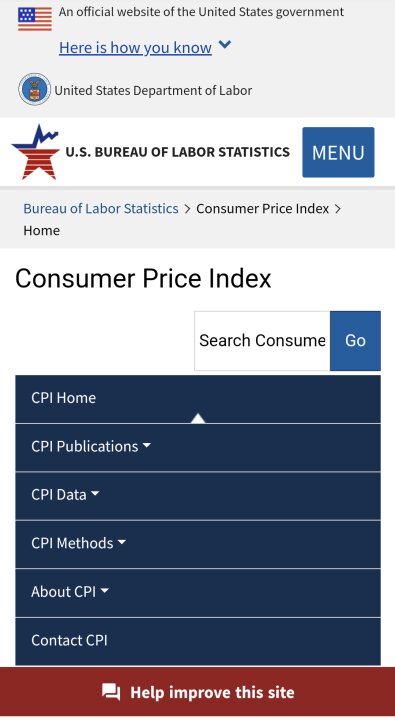
To help get you started, here is the link: https://www.bls.gov/cpi/
The first image is the landing page:
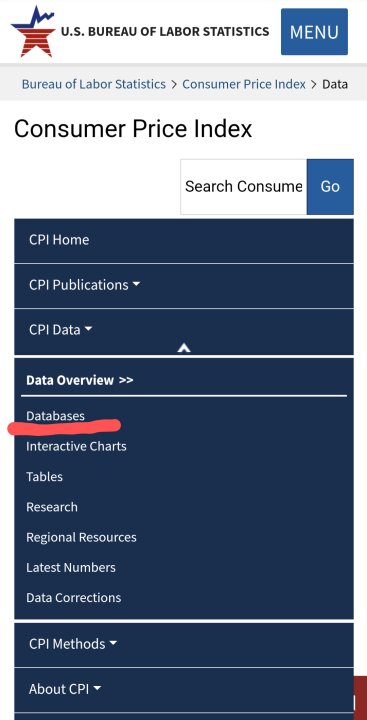
Select the CPI drop down and then select "Databases"
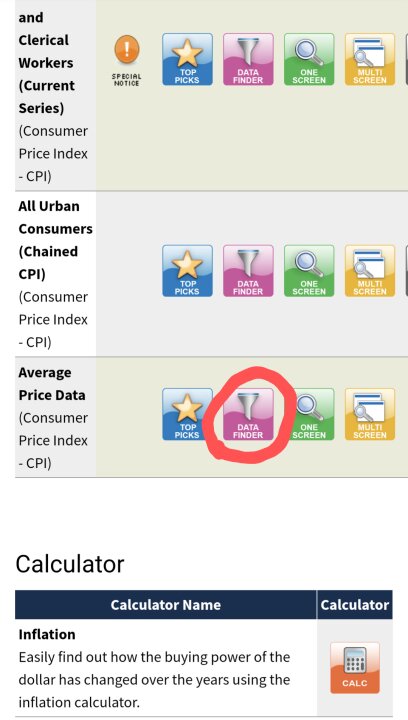
Scroll down until you see Average Price Data, and select the Data Finder icon.
Biden’s policies reduced domestic energy production. Transportation is 30% of the cost of goods and services.
Biden has increased business regulations and taxes, (especially the corporate income tax) essentially reversing Trumps regulation, policies and tax changes.
US federal spending has continued at Covid levels pumping trillions of dollars into the economy.
More dollars chasing the same amount of goods and services is inflationary. So is increasing producer costs with taxes and regulations.
Economic changes of this magnitude do not happen by accident.
Doing whatever he ( cabal) can to dupe many people into believing economically things are just grand. When he musters 100,000 at his next rally, we’ll know he has succeeded in doing that.
@soar2newhighs I see a lot of different numbers getting tossed around, with little context behind the data in order to hide the real damage. Prices shot up dramatically during Biden's first year, partly because of supply chain shocks. Prices came back down a little once the supply chain stabilized, but then they started creeping back up again. You'll hear the corporate greed excuse...but that's total BS. Inflation has impacted everything.
@4meAndyou things really skyrocketed in Biden's first 17 months in office. Then, once the inflation rate slowed, the Biden administration started their disinformation campaign about how inflation is under control. Three problems...the first is that inflation is sticky. Once prices go up, they tend to stay up. The 2nd is that inflation is still at 3.5% over the last 12 months. That only looks good compared to the 12.5% price hike we experienced in the first 17 months. The 3rd is the bold faced lie Biden is telling about inheriting an inflation rate of 9%. It was somewhere between 1.1% - 1.4%.