Top | Newest First | Oldest First
SW-User Best Comment
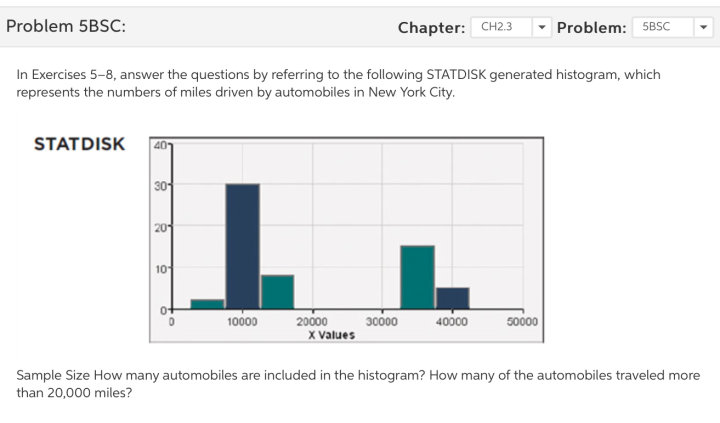
If the y-axis is not in thousands, I guess it represents 40 automobiles as the maximum and 50,000 miles as the maximum mile count. So, 10,000 has 30 cars that drove that far, for example. The rest look to need estimation
SW-User
@SW-User first answer is probably 60
Second answer looks close to 20
Sadpicasso · 22-25, F
@SW-User This is actually the right answer, do you mind explaining how you got 60 and how you identified it was 20?
MarkPaul · 26-30, M
@Sadpicasso It's right there on the chart.
How many automobiles are included...
-- 1st + 3rd bar = 10
-- 2nd bar = 30
SUBTOTAL = 40
-- 4th bar = 15
-- 5th bar = 5
SUBTOTAL = 20
TOTAL = 60
How many automobiles traveled > 20,000
-- 4th + 5th bar = 20
How many automobiles are included...
-- 1st + 3rd bar = 10
-- 2nd bar = 30
SUBTOTAL = 40
-- 4th bar = 15
-- 5th bar = 5
SUBTOTAL = 20
TOTAL = 60
How many automobiles traveled > 20,000
-- 4th + 5th bar = 20
SW-User
Just a visual guess I'd go with 60 cars included with 20 going over 20k.
GLITTER · 36-40, F
SW-User
You will find your answer if you observe graphic bar after 30000.
Ian123 · 61-69, M
I would go for 60 and 20.
Sadpicasso · 22-25, F
@Ian123 How'd you get this?
Ian123 · 61-69, M
@Sadpicasso The first three columns are 2, 30 and 8 which will give you 40. The other two columns are 15 and 5 giving you 20. Add those together to get 60
For the second question th columns are 15 and 5. Gives you 20
The graph could do with being bigger 😀
Hope this is right 🤗
For the second question th columns are 15 and 5. Gives you 20
The graph could do with being bigger 😀
Hope this is right 🤗
SW-User
5 and 1 is my guess
MartinTheFirst · 22-25, M
15 + 5 my dude. just look at the graph after 20,000 miles, and measure the height